

The US Dollar tanked at the FOMC rate decision on Wednesday and both EUR/USD and GBP/USD broke out to fresh highs. Notably, however, USD/JPY retained bullish structure with ahold at the 155.00 level, setting the stage for next week’s Bank of Japan rate decision. But before we get to that we’ll get some US data to work with in the form of NFP and CPI reports.
US Dollar Breakdown on FOMC
US Dollar bears had an open door to push fresh lows this week and at this point, the 98.98 level that became a sticking point in 2025 trade has been taken-out again. While the Fed wasn’t as dovish as rates markets were expecting, the context surrounding the meeting was surprising on a couple of fronts. First was the announcement of Treasury Bill purchases, which while not the QE that many claimed it to be, it was a far earlier announcement than what was being expected. But perhaps more surprising was Jerome Powell’s claim during the press conference that he thought the US was losing about 20,000 jobs per month, which gave a quick shot of weakness to the USD that sent the currency spiraling lower.
On that front, we’ll finally get some data in the week ahead with the delayed release of a Non-farm Payrolls report and that will be followed by a release of CPI data. And then the Bank of Japan is highly expected to lift rates towards the end of the week at their final rate decision of the year; but as has become customary, the bigger question is whether they lay the groundwork for another hike and that will be the likely driver behind price action.
In the USD, I remain of the mind that trends will be determined by whether EUR/USD can continue to rallyhttps://www.forex.com/en-us/news-and-analysis/eur-usd-remains-the-key-for-fx-market-trends/. That’s been a stumbling block in the second half of the year but given the deviation discussed in the Tuesday webinar, with Isabel Schnabel saying that she was comfortable with markets expecting the ECB’s next move to be a hike, there’s possible disparity in rate policy between the two economies and that can justify a bullish lean on the fundamental side of the pair.
In the USD, the resistance looked at in the Tuesday webinar held as DXY built a bear flag formation. That was broken at the rate decision on Wednesday and sellers continued to push, erasing a large portion of the prior Q4 gain. Going into next week, the 98.98 level can now be re-purposed as resistance potential, and for more aggressive approaches, there’s a prior swing level at 98.60 that caught a quick bounce that’s also of interest.
US Dollar Four-Hour Chart
Chart prepared by James Stanley; data derived from Tradingview
USD Bigger-Picture
Going into next week that Q4 open price is a big level as there’s a couple of different items of interest in similar vicinity.
There’s some remaining unfilled gap from early-October, spanning from 97.71-97.96. But there’s also a projected target from a double top formation nearby at 97.46. If bears can push, this would be a significant area to test and this could be looked to as the next major area of support for bearish continuation scenarios. Again, the likely key around this theme will be driven back to the Euro which I’ll look at below.
US Dollar Daily Price Chart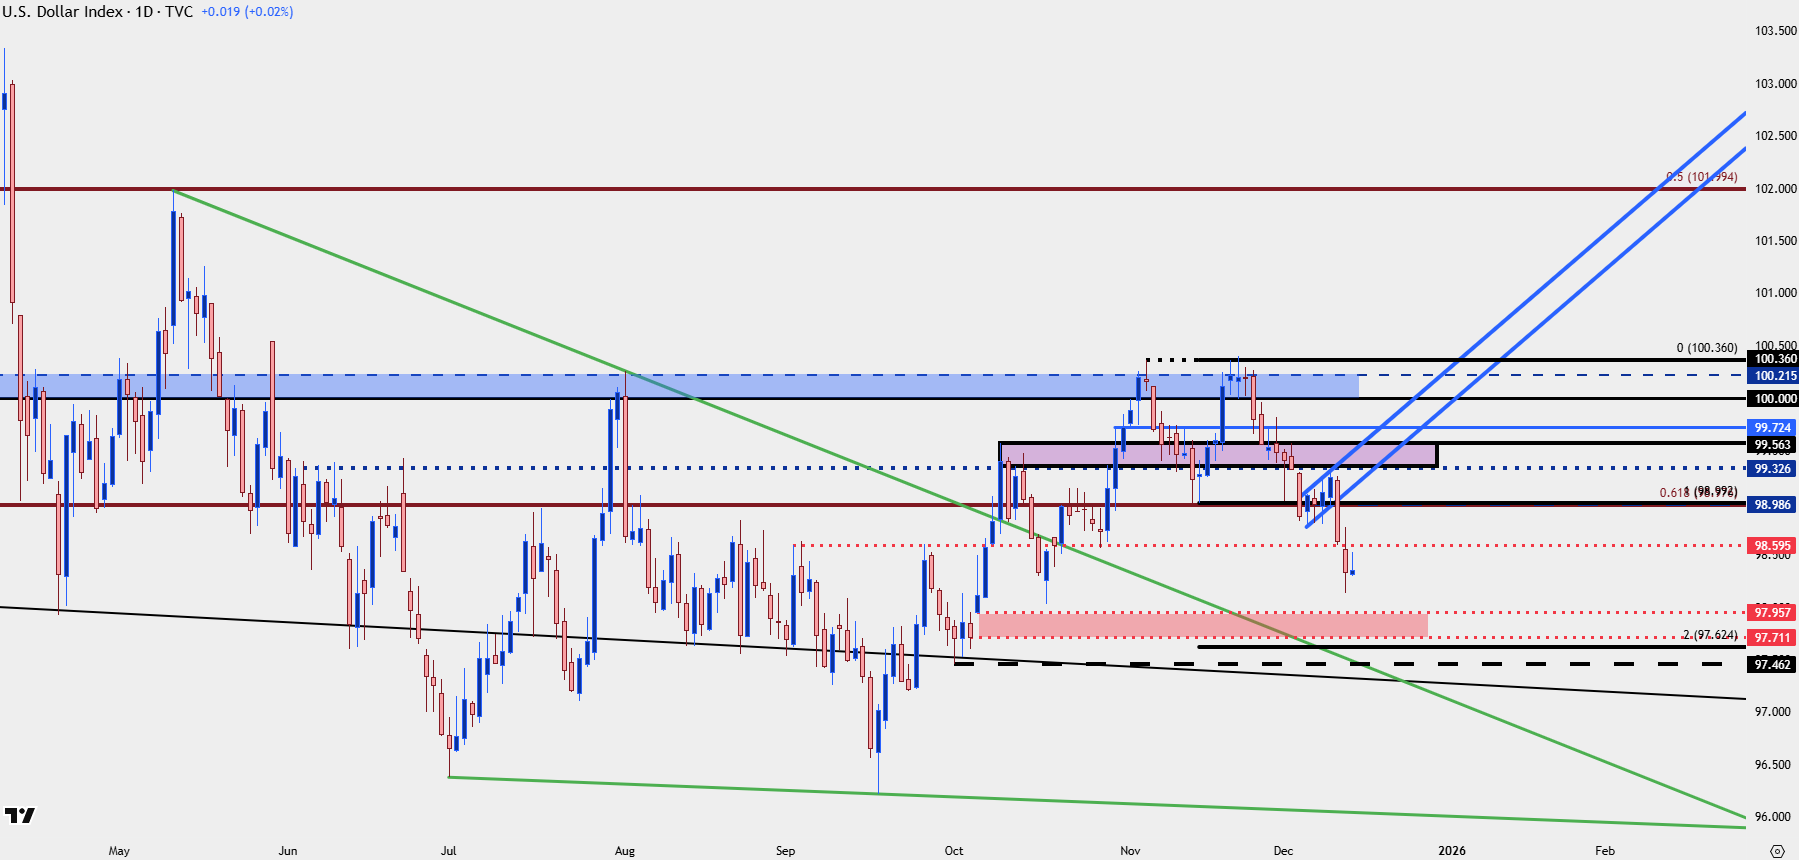
Chart prepared by James Stanley; data derived from Tradingview
EUR/USD
As we wind into the weekly close I have EUR/USD still testing at a major level of 1.1748. This is a price that’s been on the radar for much of the year as it’s the 78.6% Fibonacci retracement of the 2021-2022 major move; and it was the 23.6% retracement of that same setup that caught the lows in January and February of this year. I talked about that Fibonacci retracement at-length in the larger article on the topic of Fibonacci and I used this as an example.
Ultimately it was the 76.4 and 78.6% retracements that stymied bulls following a massive rally in the first-half of the year.
EUR/USD Weekly Chart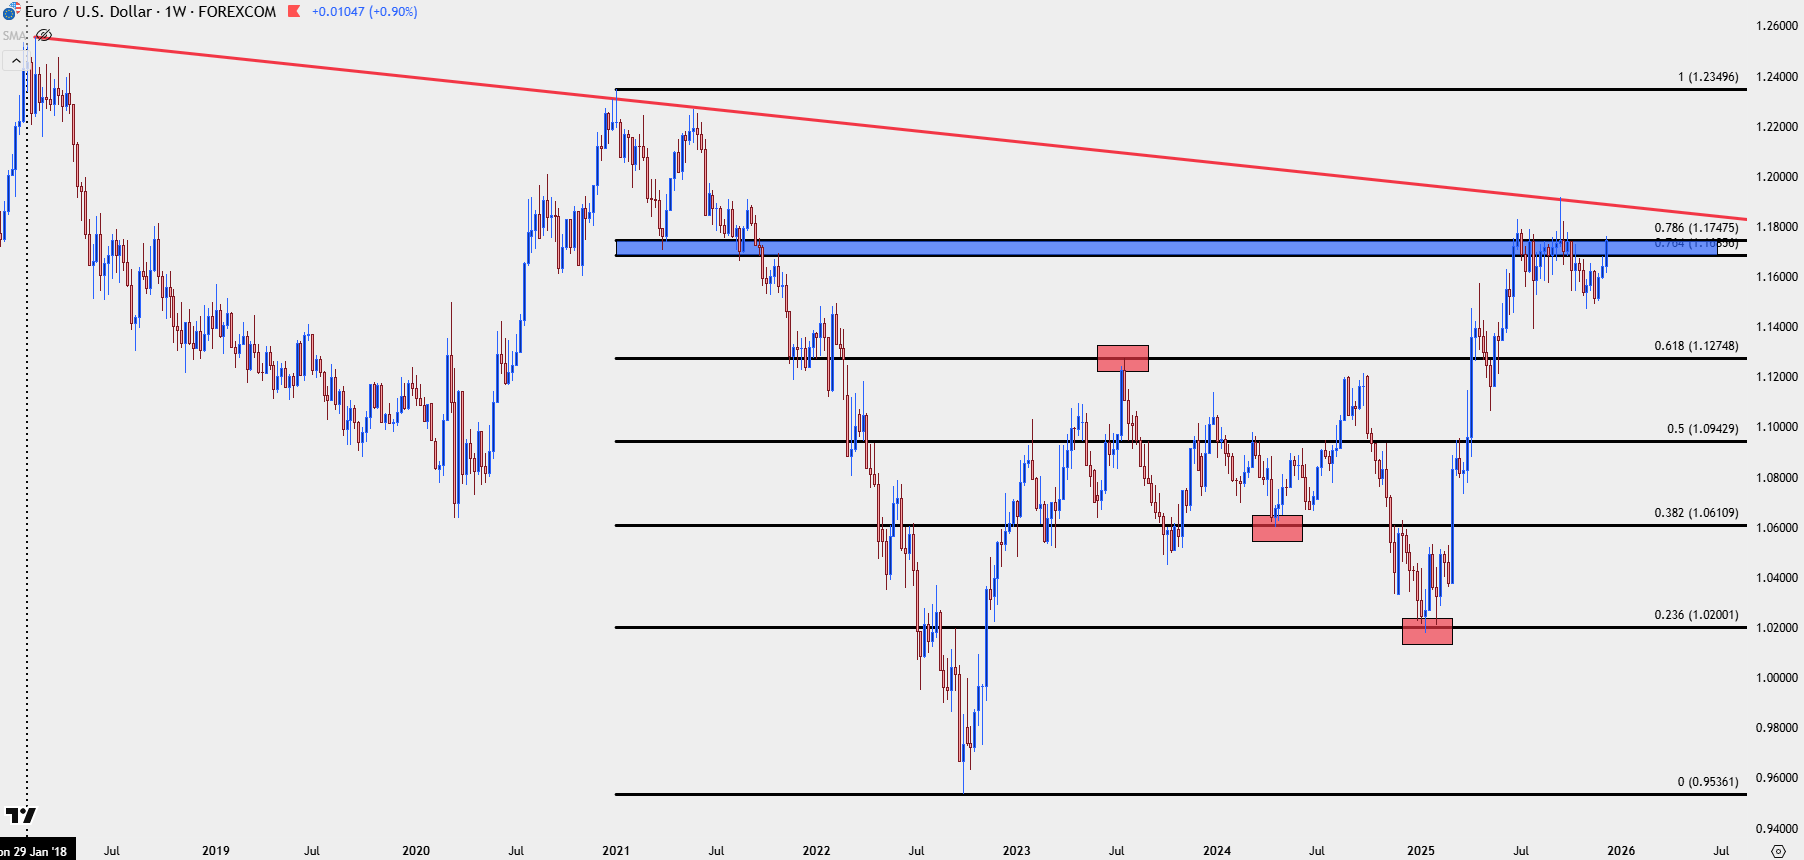
Chart prepared by James Stanley; data derived from Tradingview
EUR/USD Shorter-Term
Those prices played a big role in Q4, with 1.1748, the current level of resistance, showing as a lower-high in early-October trade. That led to a lower-low and then another lower-high printed at the 76.4% retracement of 1.1686. That sell-off ultimately stalled at the 1.1500 level where a higher-low built in late-November and that’s led into the current higher-high and re-test of the 1.1748 level, thereby opening the door for bulls to take a shot at a breakout and fresh highs. And if they’re successful, we’ll probably see those deeper support levels come into play on the US Dollar.
EUR/USD Daily Chart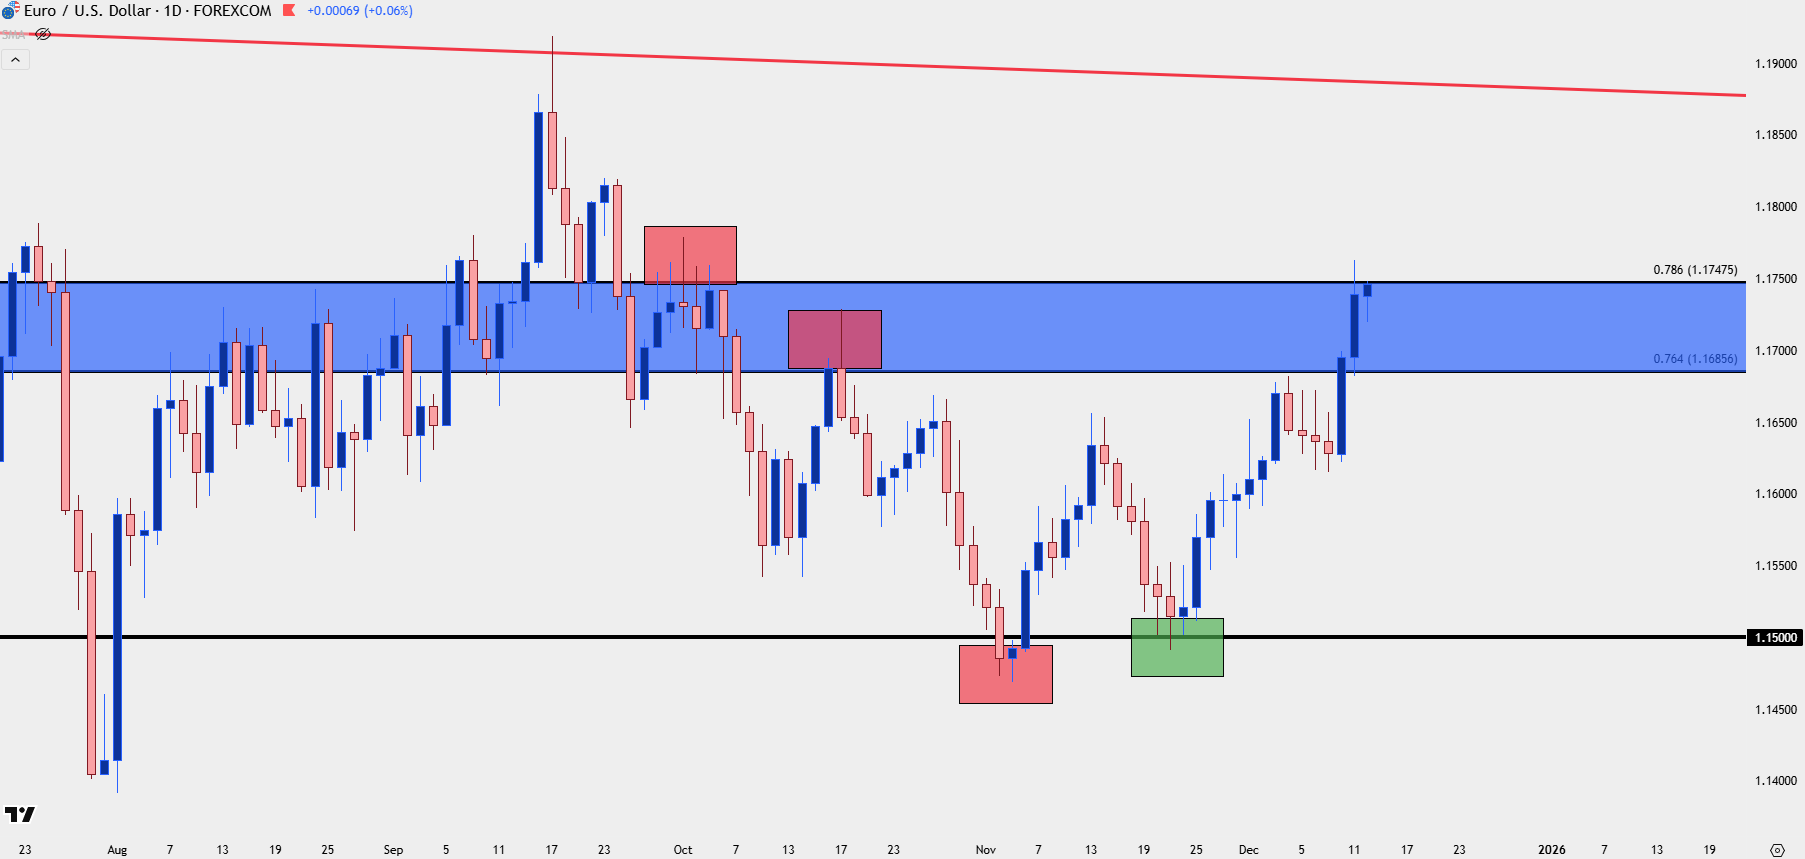
Chart prepared by James Stanley; data derived from Tradingview
EUR/USD Shorter-Term Structure
Given the rally up to a fresh higher-high this week, bulls have a shot to push a larger trend and the Fibonacci levels referenced above play a role in that.
The prior resistance zone of lower-highs from October and November is key as this resistance hasn’t yet been re-tested as support. If we do see this come into play there’s a good chance that headlines will start to paint the USD breakout as failure, which is interestingly where bearish DXY themes would probably be most attractive, at least in my opinion. But between current price and that zone, we have the 1.1686 Fibonacci level and a shorter-term Fibonacci level at 1.1717. For invalidation, I’m looking to the 1.1616 support level from this past week.
EUR/USD Four-Hour Chart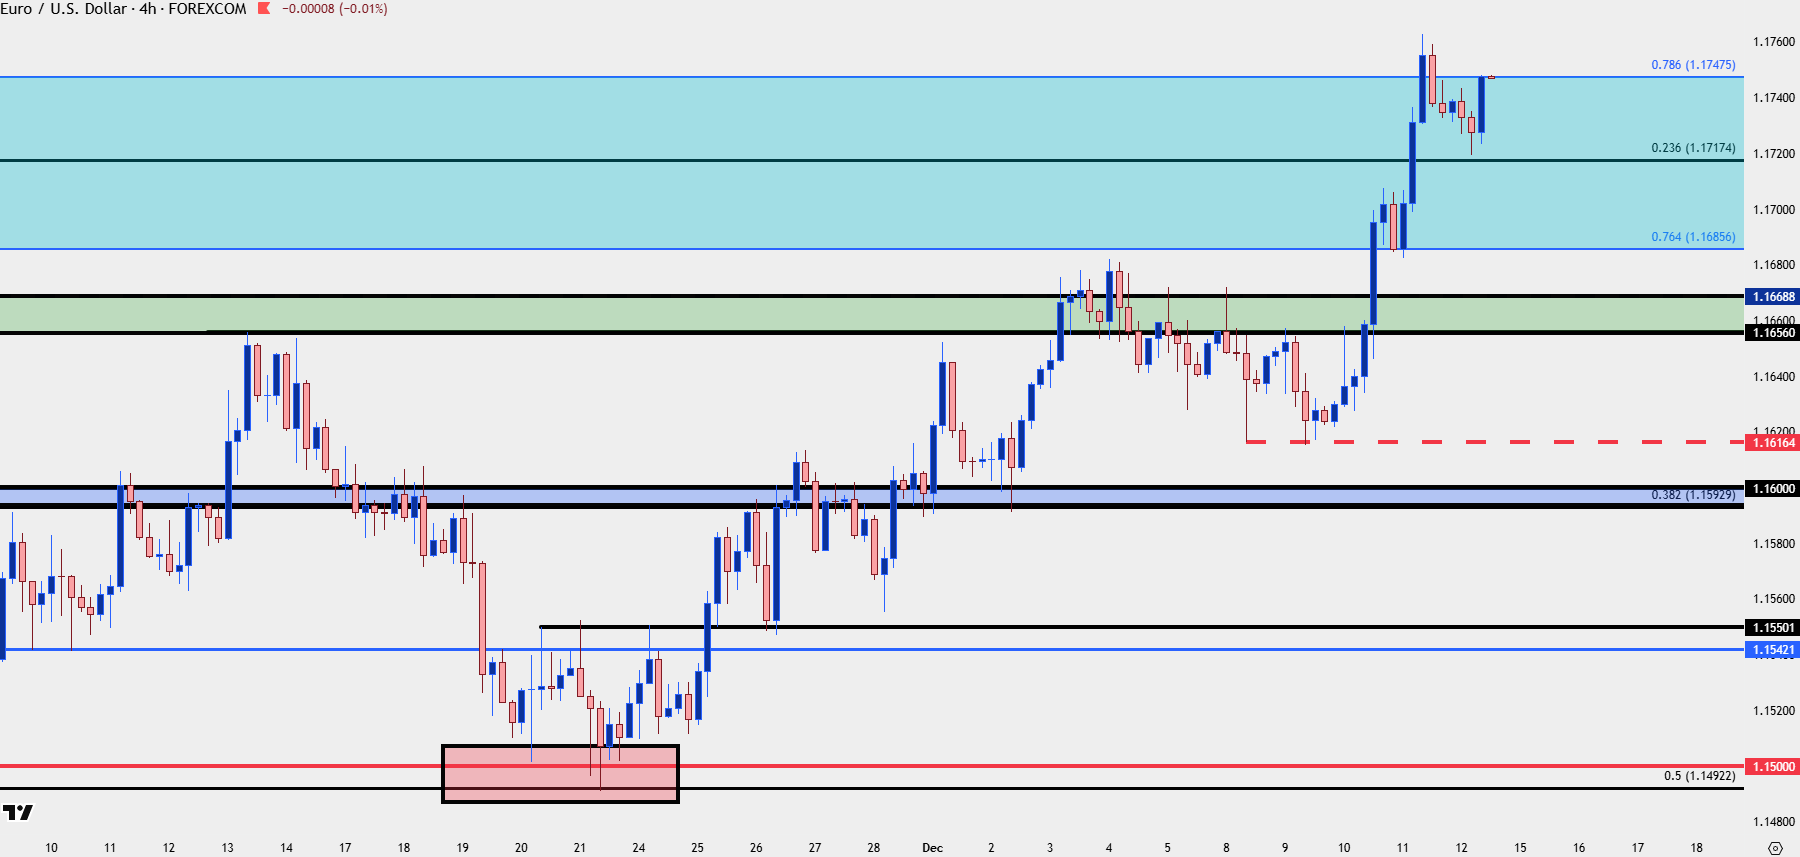
Chart prepared by James Stanley; data derived from Tradingview
GBP/USD: A Shift Ahead?
I’ve been favoring GBP/USD for USD-weakness plays of late but as I posed in the Monday GBP article, there may be a shift ahead and I referenced EUR/GBP dynamics for that previously. But what has my attention at this point is the disparity between EUR/USD and GBP/USD.
While both still show bullish structure, GBP/USD put in an indecision candle on the daily after testing the Fibonacci level at 1.3414. For a portion of Friday, it looked like an evening star might be in the works, although sellers couldn’t pose follow-through. Nonetheless, the daily chart of Cable doesn’t share the same strength as the EUR/USD setup looked at above, and continued deviation between the two major pairs can set up EUR/USD as a more attractive venue to push that USD-weakness backdrop.
In GBP/USD, I still have strong bullish structure in the mix following the support hold at 1.3287 from the Tuesday webinar, so that’s the spot that I would like to see buyers defend to retain control of the trend. Above that, and perhaps even more ideal, would be the Fibonacci level at 1.3328.
GBP/USD Daily Chart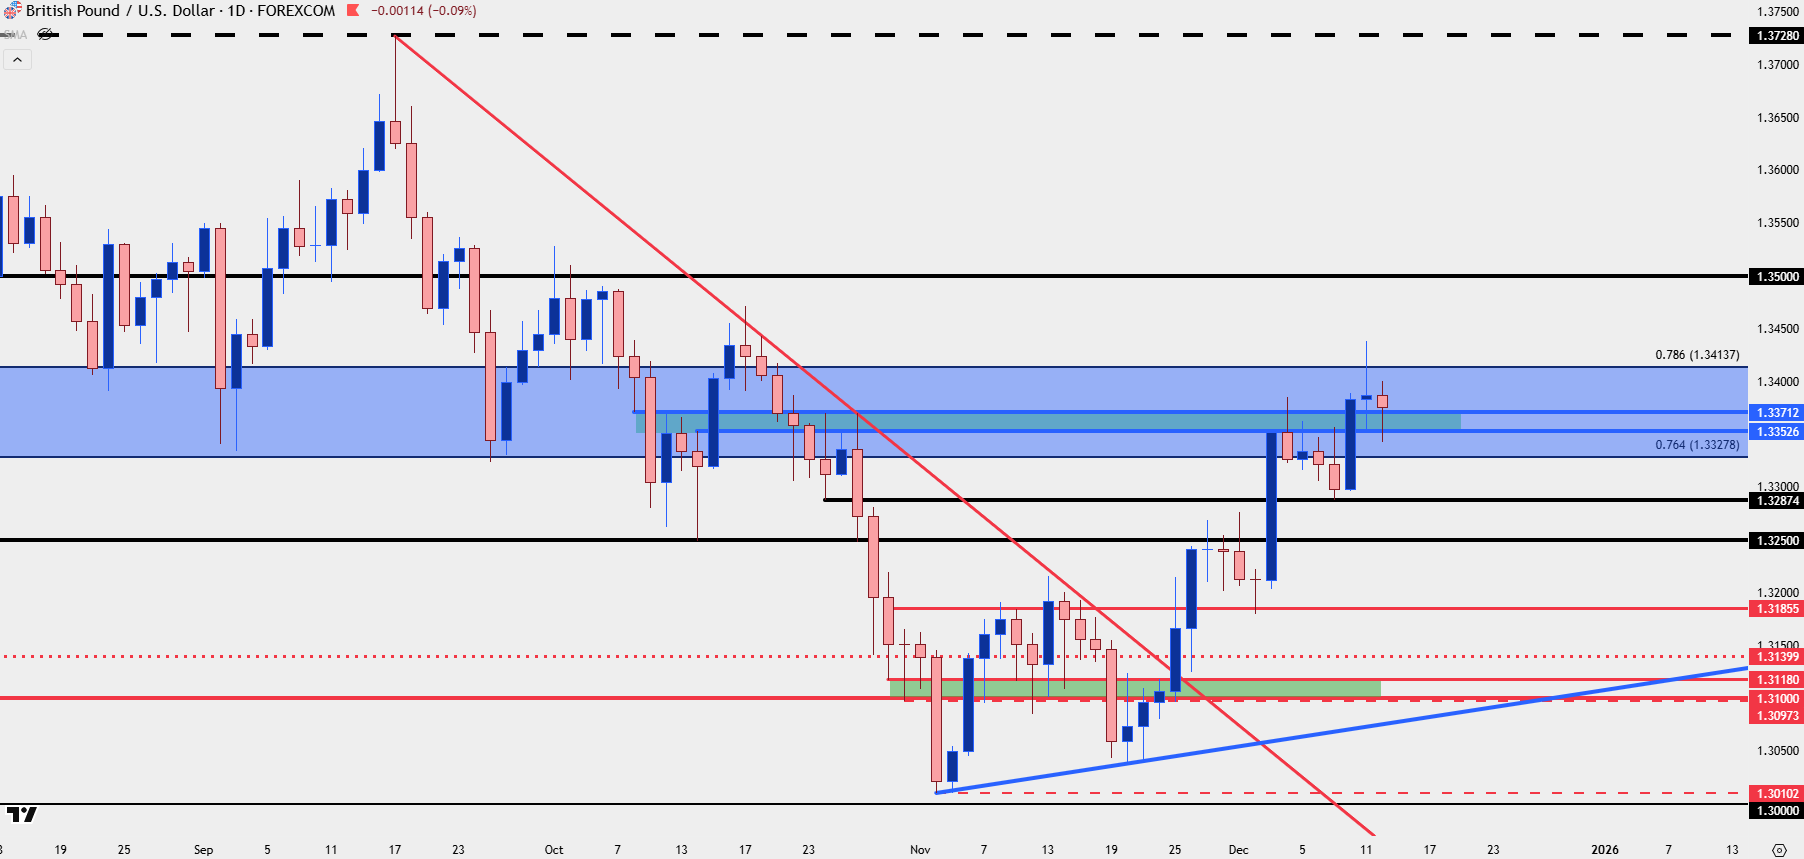
Chart prepared by James Stanley; data derived from Tradingview
USD/JPY
For USD-strength setups, I’m still tracking USD/JPY, and by extension, this can keep both EUR/JPY and GBP/JPY as attractive venues given the Yen-weakness that’s remained in the mix.
As USD-weakness has been on full display against both the Euro and British Pound, USD/JPY held a higher low at a massive spot of support. I went over this scenario in the Tuesday webinar, highlighting the 155.00 level as a key spot for buyers to defend in USD-weakness scenarios, and so far, that’s held.
The big item for next week on the pair is the Bank of Japan rate decision. It seems almost a foregone conclusion that the BoJ will hike rates, but more pressing is whether they open the door to more rate hikes in 2026, and that’s a complicated ordeal as explained in the article from last Thursday as that low was getting carved out, entitled USD/JPY Tests Key Support at 155 as Ueda Tests the Tightrope.
USD/JPY Four-Hour Chart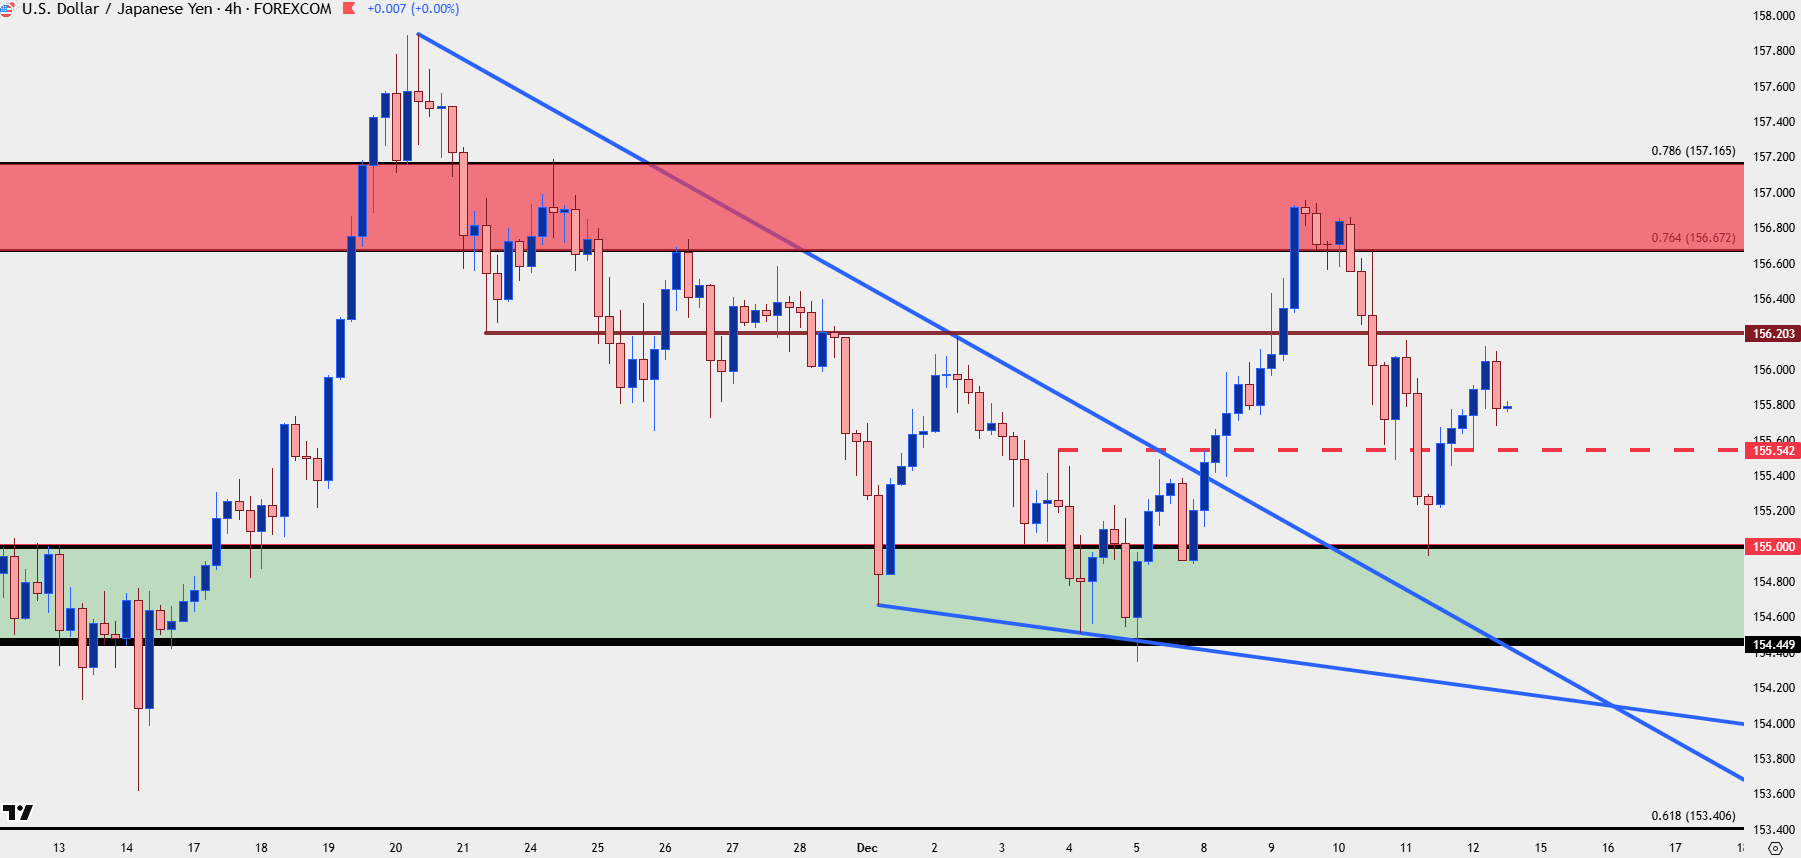
Chart prepared by James Stanley; data derived from Tradingview
USD/CAD
USD/CAD unfurled in a big way over the past two weeks, and I followed this closely in webinars as it was the pair’s reaction at the 1.4000 handle that made it look as though bulls were starting to lose the grip. The sell-off over the past couple of weeks has been massive, but now USD/CAD is stalling at a major level from this year – the 1.3750 level that marked resistance in the ascending triangle that built in June and July and then set the higher-low before the Q4 rally.
At this point, the pair is now in oversold territory on the daily for the first time since July, which previously marked a major low. This can be an opening door for a bullish reversal setup for those that do want to push strategies of USD-strength, but next week will be key on that front. As covered in the video, what would be important is buyers ultimately holding prices above 1.3750, even if there is an intra-day test below that price.
USD/CAD Daily Chart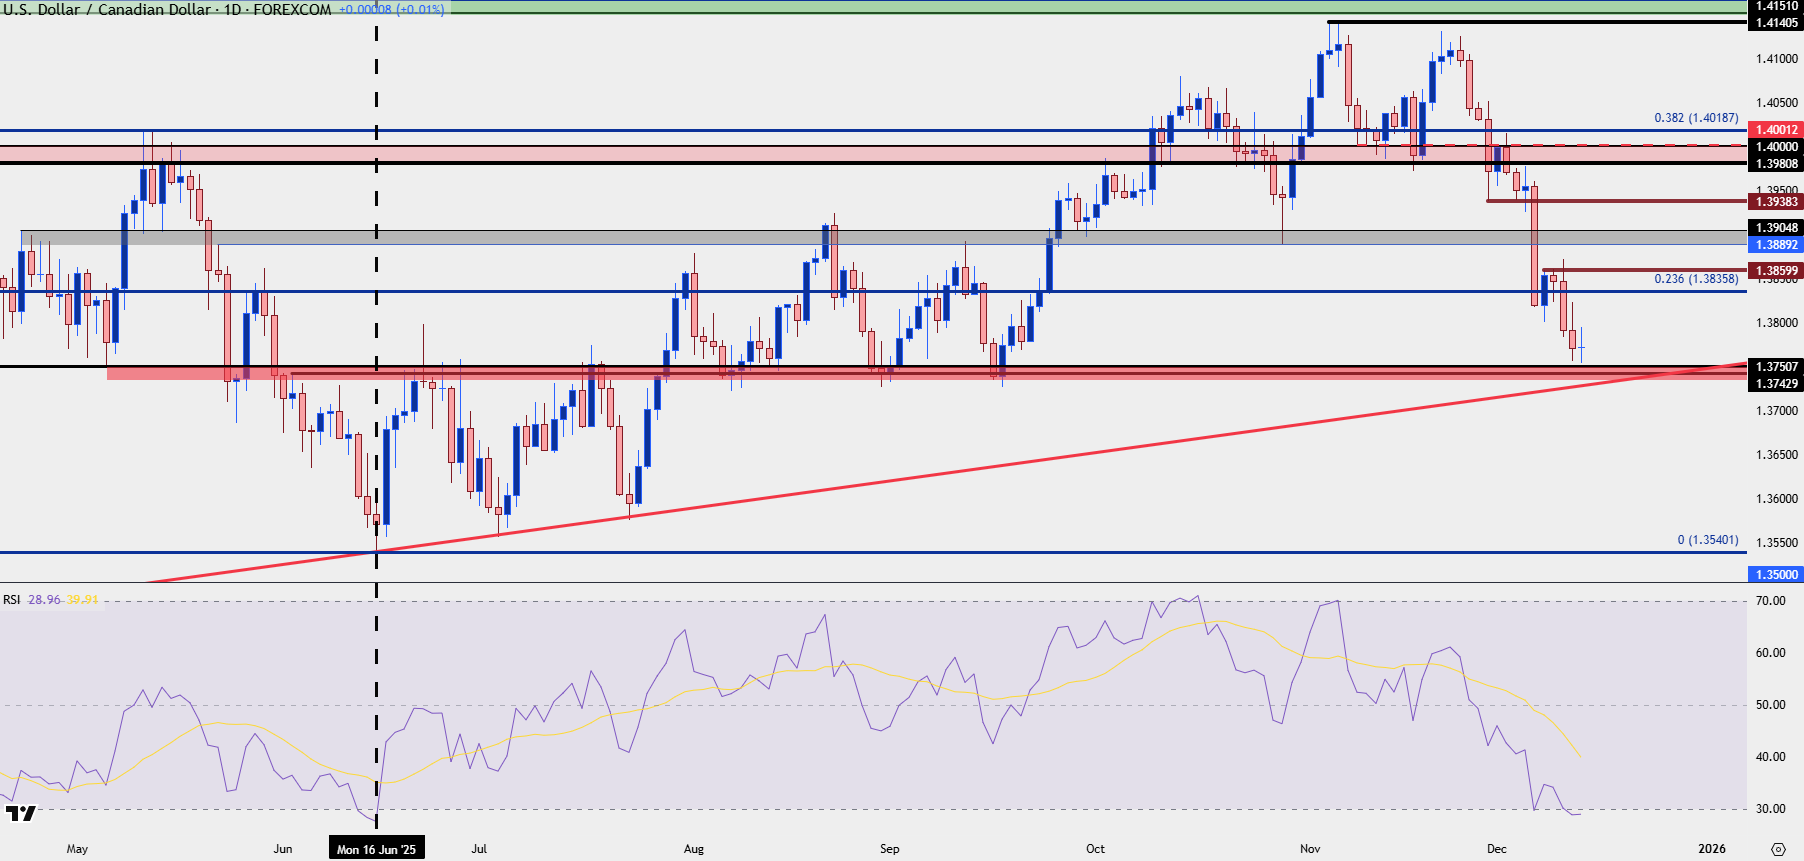
Chart prepared by James Stanley; data derived from Tradingview
--- written by James Stanley, Senior Market Analyst, Global Macro