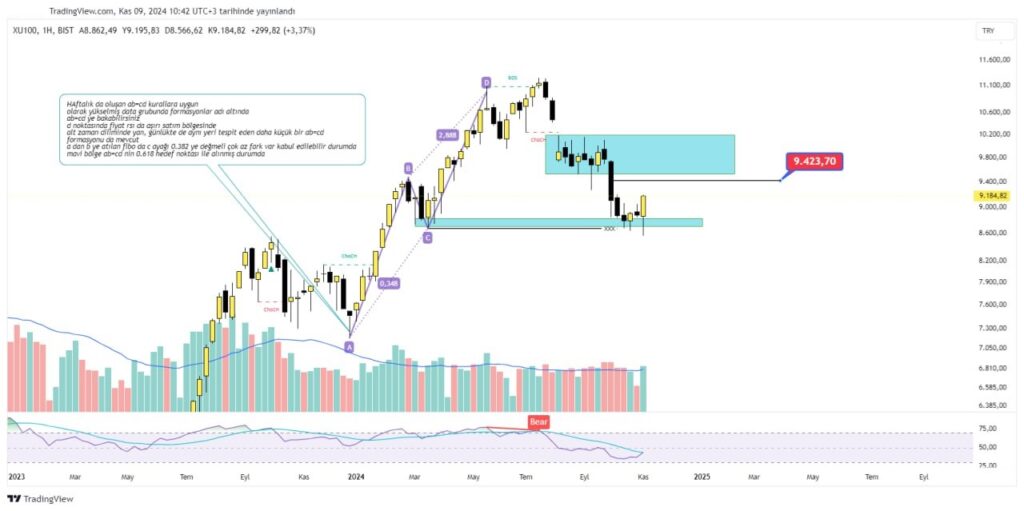
#xu100
spot daily
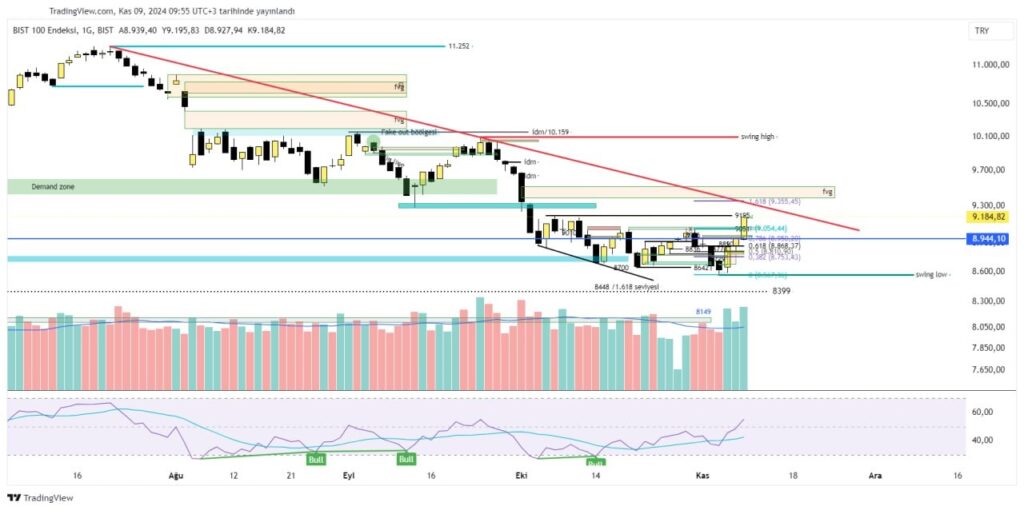
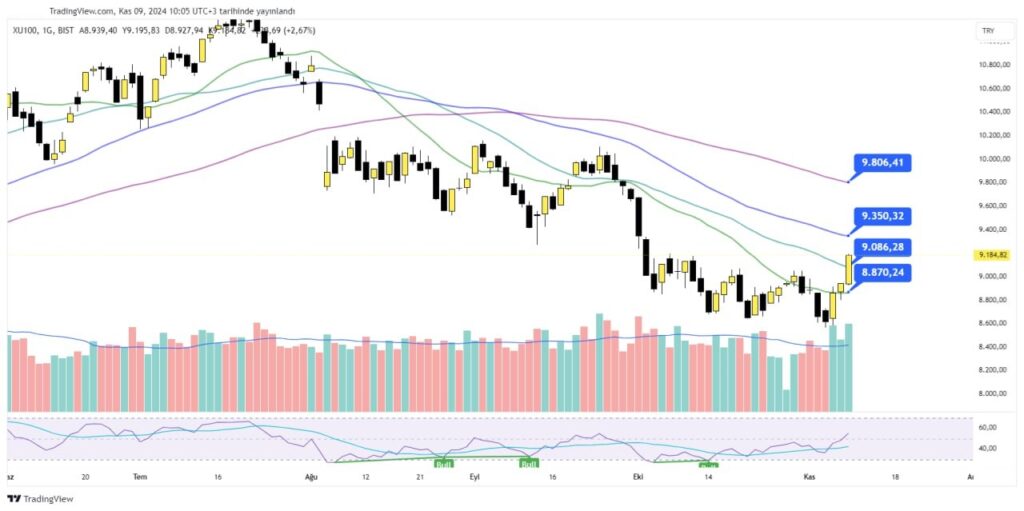
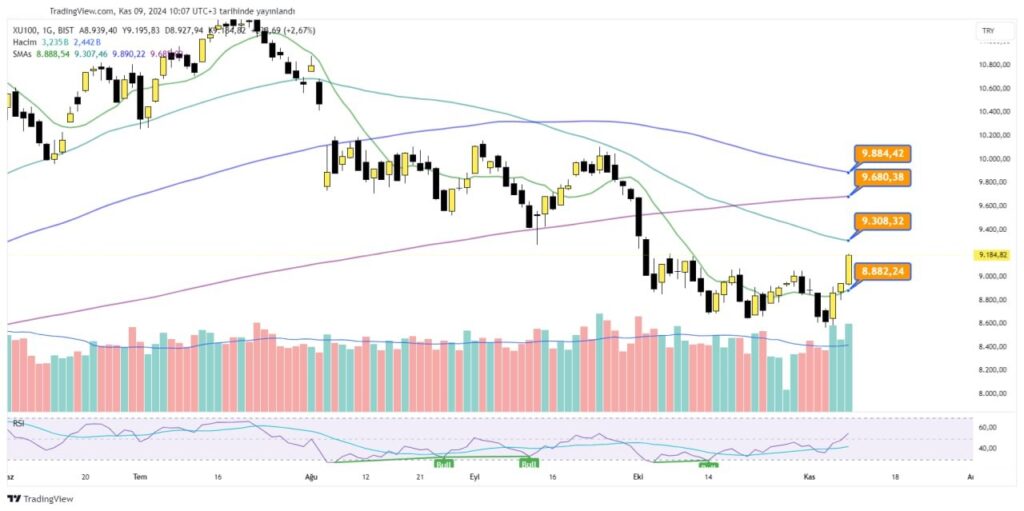
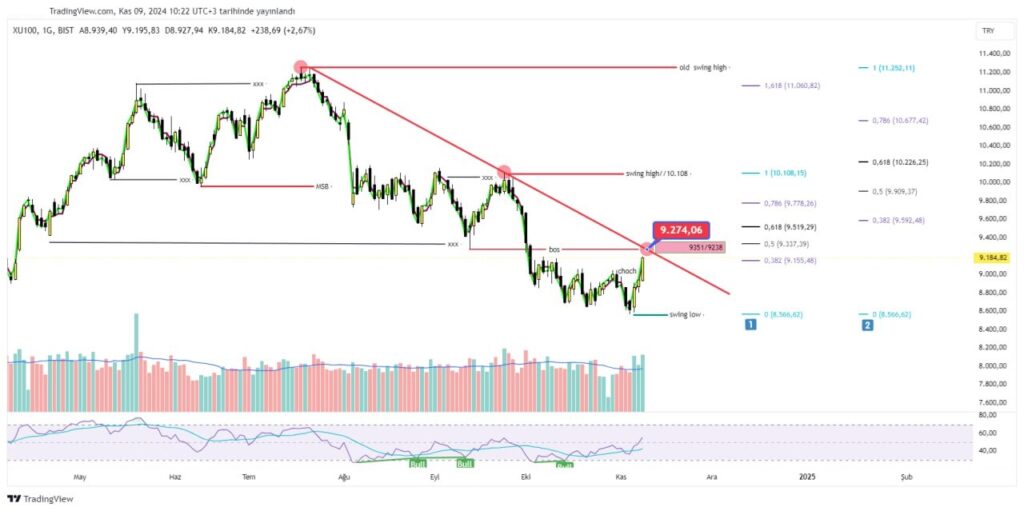
the last region of the chart is confused because it is drawn ltf don’t look there the important place here is the intersection of the falling trend with the fibo extension 1.618 drawn from the bottom right last peak may be the most challenging place ahead there, also the blue zone +fvg gap start location is almost in the same regions averages fibo figures 21/34/55/89 chart in blue conservative averages classic 10/50/100/200 values 4. graphic I drew it according to the market structure, in the structure that was currently choch (character change) the falling channel intersects at 9274 with the level that makes the last bos (ltf de) in that region, there is also a hidden base (hidden region) in that region, the lower levels of which are written in the box, the fibo extension levels I threw on the right side are taken from the 1st last swing and the 2nd old peak.
most indicator generated a buy signal at the lowest red candle
the latest chart is the weekly log the middle level of the last seller’s candle is written on the chart, above that is the positive zone, but we still need to win that candle, then we can probably go up to the gap closure.


