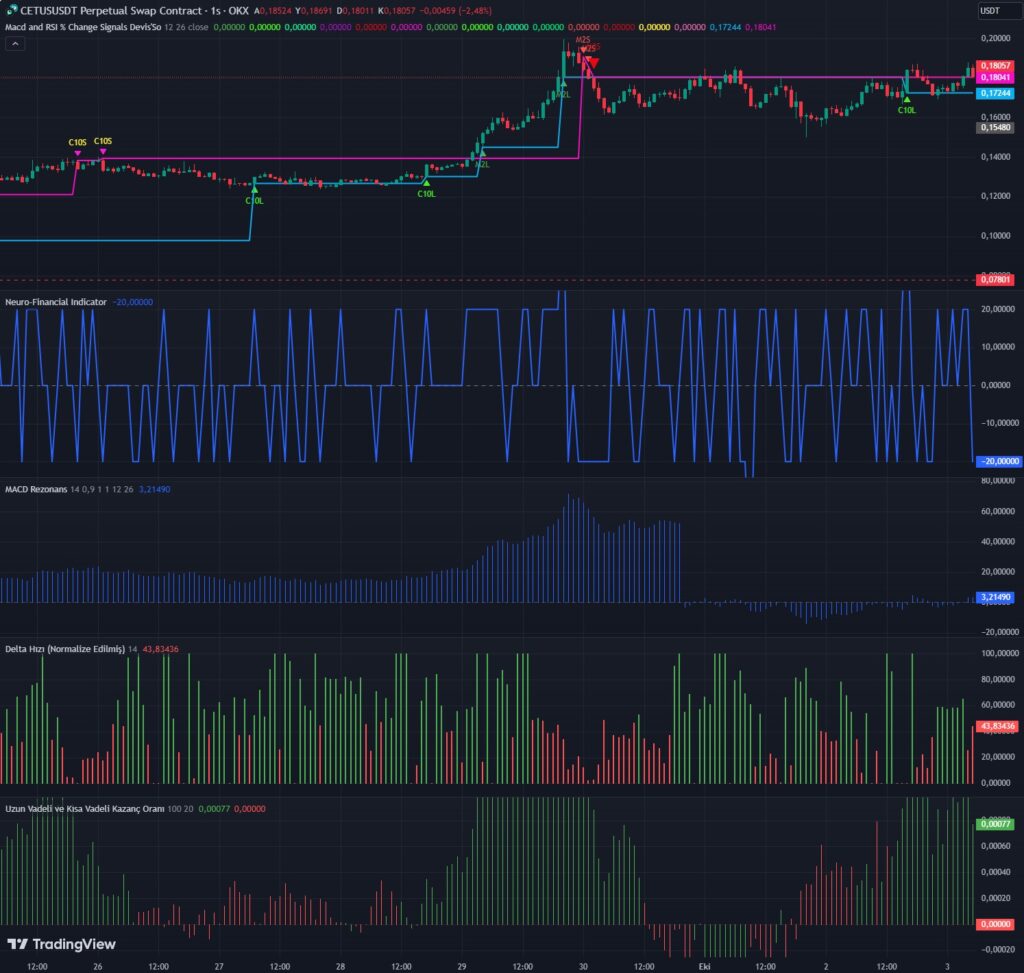
20% change creates very strong candles and leads to trend reversals. When 10% candles form, you can trade in a way that liquidates these candles. Similarly, for MACD, there are strengths of 2%, 3%, 4%, and 5%. Strong candles indicate trend reversals.
Sürüm Notları
20% change creates very strong candles and leads to trend reversals. When 10% candles form, you can trade in a way that liquidates these candles. Similarly, for MACD, there are strengths of 2%, 3%, 4%, and 5%. Strong candles indicate trend reversals.
Sürüm Notları
20% change creates very strong candles and leads to trend reversals. When 10% candles form, you can trade in a way that liquidates these candles. Similarly, for MACD, there are strengths of 2%, 3%, 4%, and 5%. Strong candles indicate trend reversals. Add 2pulback levels.
Pine Script™ indikatörü
Macd and RSI % Change Signals
// This Pine Script™ code is subject to the terms of the Mozilla Public License 2.0 at https://mozilla.org/MPL/2.0/
// © engineerofmoney
//@version=5
indicator(“Macd and RSI % Change Signals Devis’So”, overlay=true)
logHigh = math.log(high)
logLow = math.log(low)
logClose = math.log(close)
rsihigh = ta.rsi(logHigh, 14)
rsilow = ta.rsi(logLow, 14)
rsiclose = ta.rsi(logClose, 14)
// RSI değişimi
rsiChangehigh = ta.change(rsihigh)
rsiChangelow = ta.change(rsilow)
rsiChangeclose = ta.change(rsiclose)
long_signal1 = ta.crossover(rsiChangeclose, 20)
long_signal2 = ta.crossover(rsiChangeclose,10)
long_signal3 = ta.crossover(rsiChangelow, 20)
short_signal1 = ta.crossunder(rsiChangelow, -20)
short_signal2= ta.crossunder(rsiChangeclose, -20)
short_signal3= ta.crossunder(rsiChangeclose,-10)
// Getting inputs
fast_length = input(title = “Fast Length”, defval = 12)
slow_length = input(title = “Slow Length”, defval = 26)
src = input(title = “Source”, defval = close)
signal_length = input.int(title = “Signal Smoothing”, minval = 1, maxval = 50, defval = 9, display = display.data_window)
sma_source = input.string(title = “Oscillator MA Type”, defval = “EMA”, options = [“SMA”, “EMA”], display = display.data_window)
sma_signal = input.string(title = “Signal Line MA Type”, defval = “EMA”, options = [“SMA”, “EMA”], display = display.data_window)
// Calculating
fast_ma = sma_source == “SMA” ? ta.sma(src, fast_length) : ta.ema(src, fast_length)
slow_ma = sma_source == “SMA” ? ta.sma(src, slow_length) : ta.ema(src, slow_length)
macd = ta.change(ta.rsi((fast_ma – slow_ma),100))
signal =ta.change( ta.rsi(sma_signal == “SMA” ? ta.sma(macd, signal_length) : ta.ema(macd, signal_length),100))
top=(macd+signal)/2
long_signal11 = ta.crossover(macd,2) or ta.crossover(signal,2) or ta.crossover(top,2)
long_signal21 = ta.crossover(macd, 3) or ta.crossover(signal, 3) or ta.crossover(top,3)
long_signal31 = ta.crossover(macd, 4) or ta.crossover(signal, 4) or ta.crossover(top, 4)
long_signal41 = ta.crossover(macd, 5) or ta.crossover(signal, 5) or ta.crossover(top, 5)
short_signal11 = ta.crossunder(macd, -2) or ta.crossunder(signal, -2) or ta.crossunder(top, -2)
short_signal21= ta.crossunder(macd, -3) or ta.crossunder(signal, -3) or ta.crossunder(top, -3)
short_signal31= ta.crossunder(macd, -4) or ta.crossunder(signal, -4) or ta.crossunder(top, -4)
short_signal41= ta.crossunder(macd, -5) or ta.crossunder(signal, -5) or ta.crossunder(signal, -5)
// Plot long signals
plotshape(series=long_signal1, location=location.belowbar, color=color.green, style=shape.triangleup, text=”C20L”, size=size.normal, textcolor=color.green)
plotshape(series=long_signal2, location=location.belowbar, color=#44f321, style=shape.triangleup, text=”C10L”, size=size.tiny, textcolor=#44f321)
plotshape(series=long_signal3, location=location.belowbar, color=color.rgb(26, 231, 146), style=shape.triangleup, text=”L20L”, size=size.normal, textcolor=color.rgb(26, 231, 146))
// Plot short signals
plotshape(series=short_signal1, location=location.abovebar, color=#c50fda, style=shape.triangledown, text=”L20S”, size=size.small, textcolor=color.red)
plotshape(series=short_signal2, location=location.abovebar, color=color.rgb(251, 7, 19), style=shape.triangledown, text=”C20S”, size=size.normal, textcolor=#ee07db)
plotshape(series=short_signal3, location=location.abovebar, color=#fe16d7, style=shape.triangledown, text=”C10S”, size=size.tiny, textcolor=color.yellow)
// Plot long signals
plotshape(series=long_signal11, location=location.belowbar, color=color.green, style=shape.triangleup, text=”M2L”, size=size.tiny, textcolor=color.green)
plotshape(series=long_signal21, location=location.belowbar, color=#44f321, style=shape.triangleup, text=”M3L”, size=size.small, textcolor=#44f321)
plotshape(series=long_signal31, location=location.belowbar, color=color.rgb(26, 231, 146), style=shape.triangleup, text=”M4L”, size=size.normal, textcolor=color.rgb(26, 231, 146))
plotshape(series=long_signal41, location=location.belowbar, color=color.lime, style=shape.triangleup, text=”M5L”, size=size.large, textcolor=color.lime)
// Plot short signals
plotshape(series=short_signal11, location=location.abovebar, color=color.red, style=shape.triangledown, text=”M2S”, size=size.tiny, textcolor=color.red)
plotshape(series=short_signal21, location=location.abovebar, color=color.rgb(238, 7, 18), style=shape.triangledown, text=”M3S”, size=size.small, textcolor=color.rgb(238, 7, 18))
plotshape(series=short_signal31, location=location.abovebar, color=color.yellow, style=shape.triangledown, text=”M4S”, size=size.normal, textcolor=color.yellow)
plotshape(series=short_signal41, location=location.abovebar, color=#f06ab2, style=shape.triangledown, text=”M5S”, size=size.large, textcolor=#f06ab2)
// Pullback seviyelerini tutmak için değişkenler
var float longPullbackLevel = na
var float shortPullbackLevel = na
// Long sinyalleri oluştuğunda low seviyesini pullback olarak kaydet
if long_signal1
longPullbackLevel := low
if long_signal2
longPullbackLevel := low
if long_signal3
longPullbackLevel := low
if long_signal11
longPullbackLevel := low
if long_signal21
longPullbackLevel := low
if long_signal31
longPullbackLevel := low
if long_signal41
longPullbackLevel := low
// Short sinyalleri oluştuğunda high seviyesini pullback olarak kaydet
if short_signal1
shortPullbackLevel := high
if short_signal2
shortPullbackLevel := high
if short_signal3
shortPullbackLevel := high
if short_signal11
shortPullbackLevel := high
if short_signal21
shortPullbackLevel := high
if short_signal31
shortPullbackLevel := high
if short_signal41
shortPullbackLevel := high
// Long ve short pullback seviyelerini grafikte çiz
plot(longPullbackLevel, title=”Long Pullback Seviyesi”, color=color.rgb(11, 174, 238), linewidth=2)
plot(shortPullbackLevel, title=”Short Pullback Seviyesi”, color=#f50dc3, linewidth=2)


