cryptoANDforex
-

FUN FACT
FUN FACT: 🟠 A penny now costs 3.07 cents to manufacture and distribute 😅 Bitcoin solves this. : Bitcoin
-
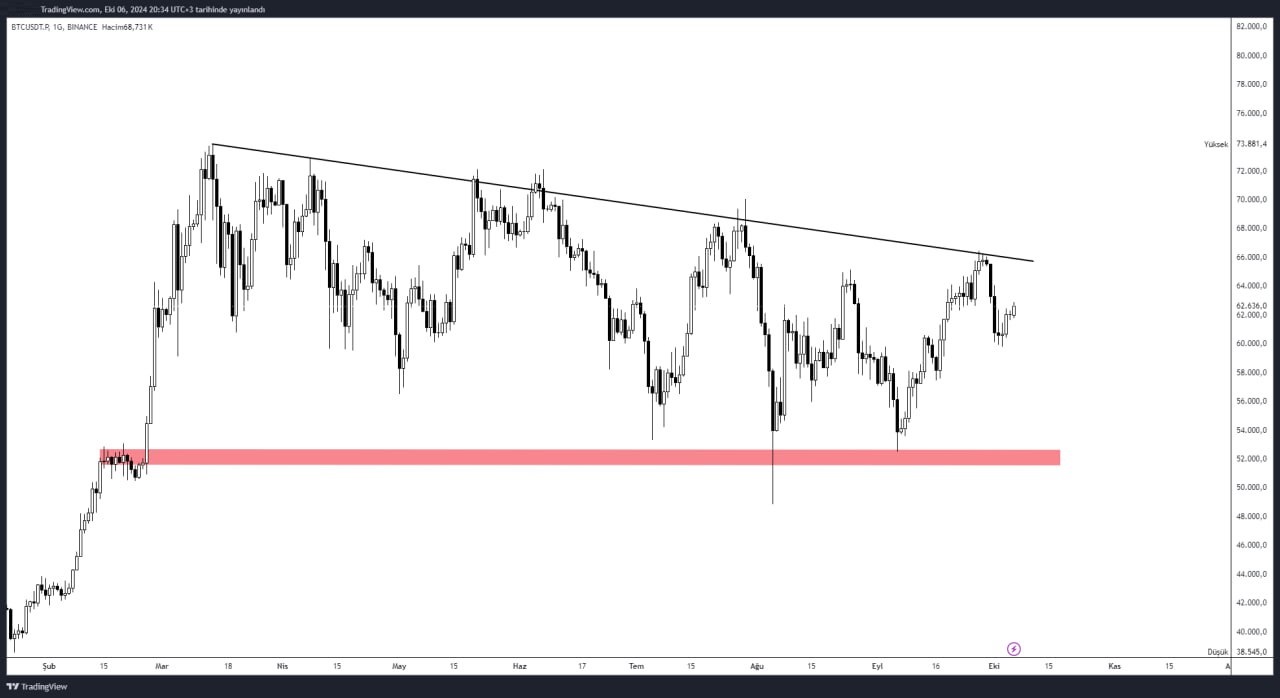
#Bitcoin 1D 👀
When we analyze it on a daily basis, if we want to speak positively next week, we need to see a closing above $ 65,800. Unless this closure comes, we will continue our movement in…
-
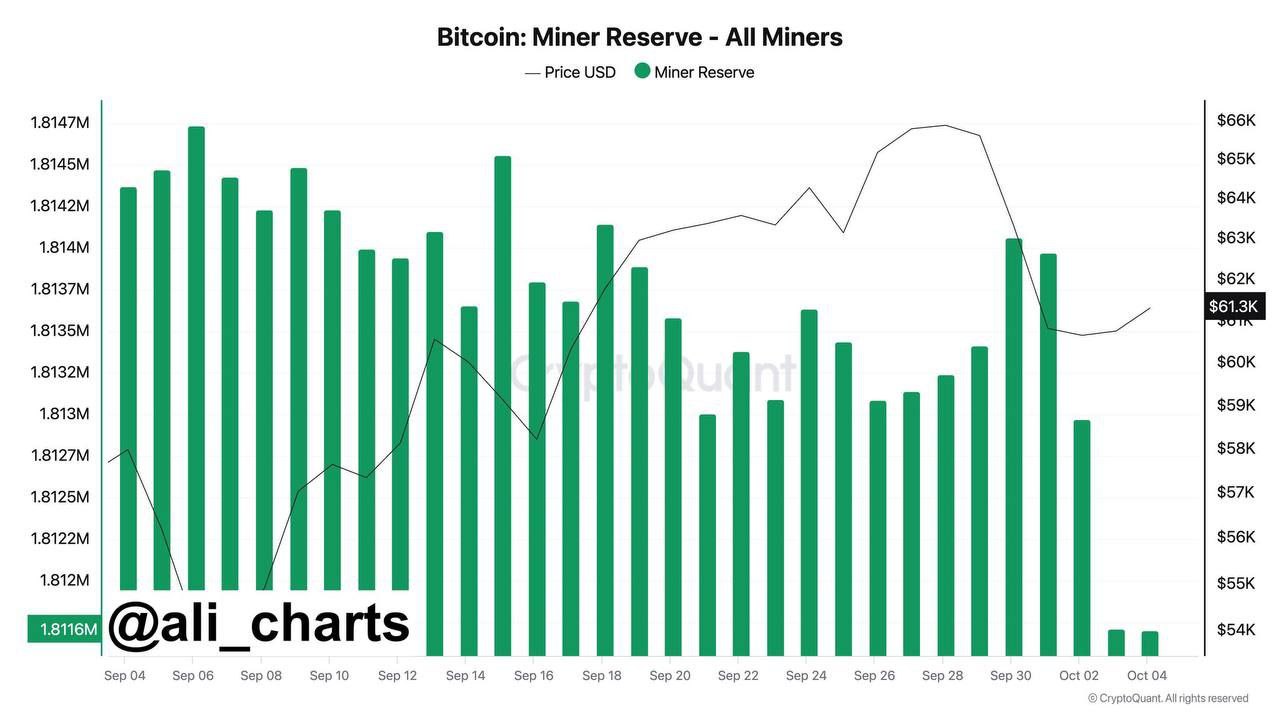
#BITCOIN: MINER REVERSE
💫Bitcoin miners have sold 2,364 BTC (about $143 million) in the last six days.
-

#BITCOIN
Bitcoin 62500 henüz geçilmedi. Grafikte bakın defalarca denendi ve geçilemedi. 61800 geçilmesi olumlu bir gelişme ama yükseliş başladı demek için henüz erken.
-

#ETH
ETH is the most important levels and these can be followed in intraday transactions. Details on the chart!
-

Congressman Ro Khanna says
🇺🇸 Congressman Ro Khanna says “Bitcoin that has been seized by the US government should be used as a strategic reserve asset given its potential for appreciation.” 🤔 : Bitcoin
-
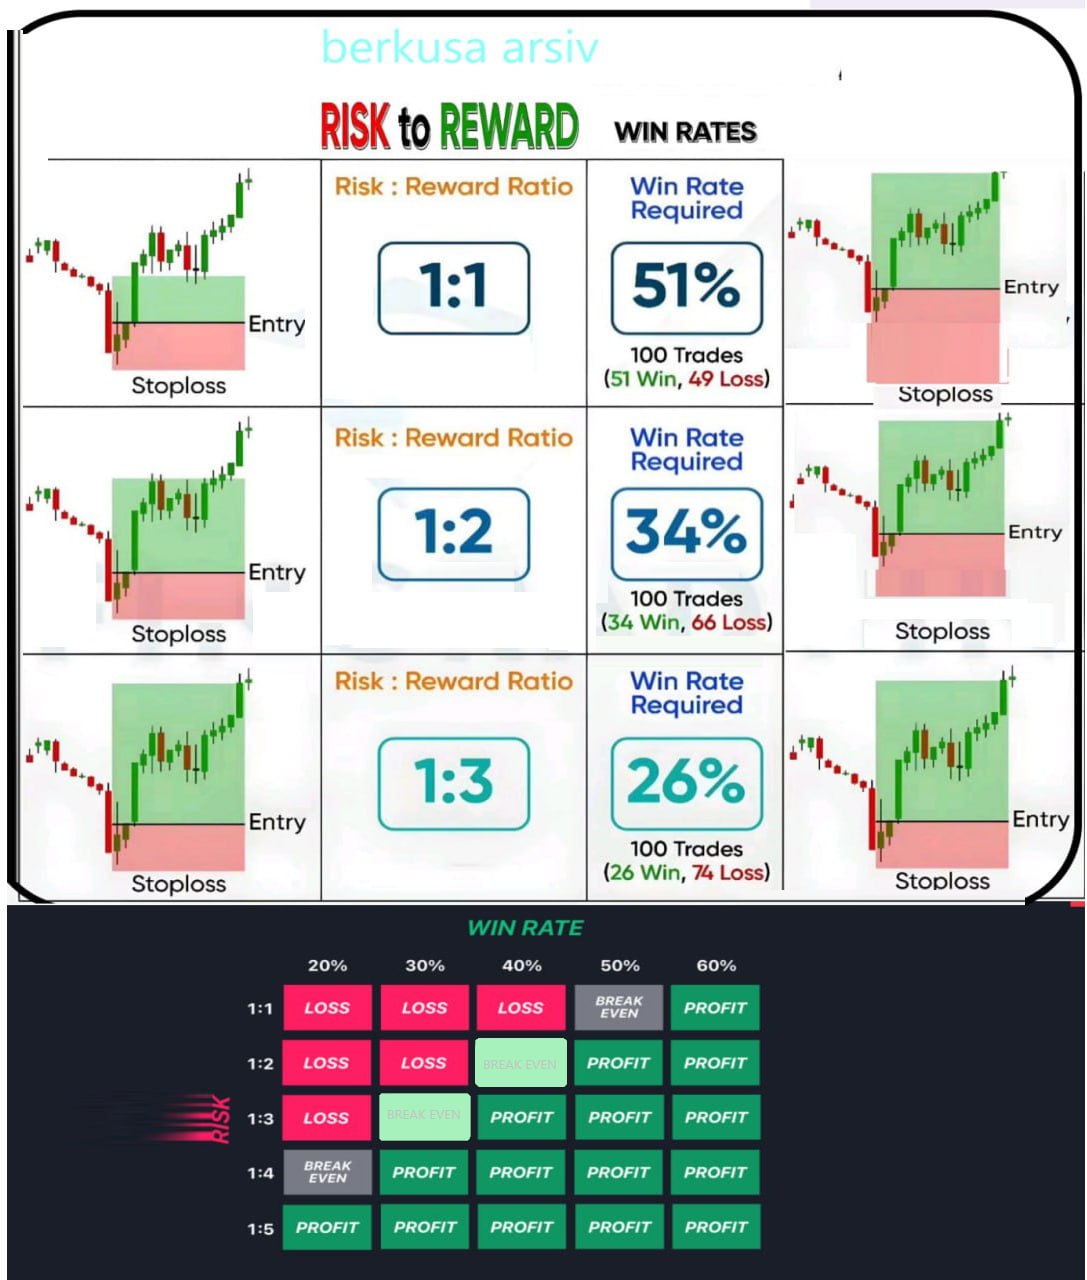
WINRATE
The image explains the relationship between the risk-to-reward ratio and the win rate required to be profitable in trading. Here’s a breakdown of the key points: Risk-to-Reward Ratio and Win Rate: Win Rate Table (Lower…
-
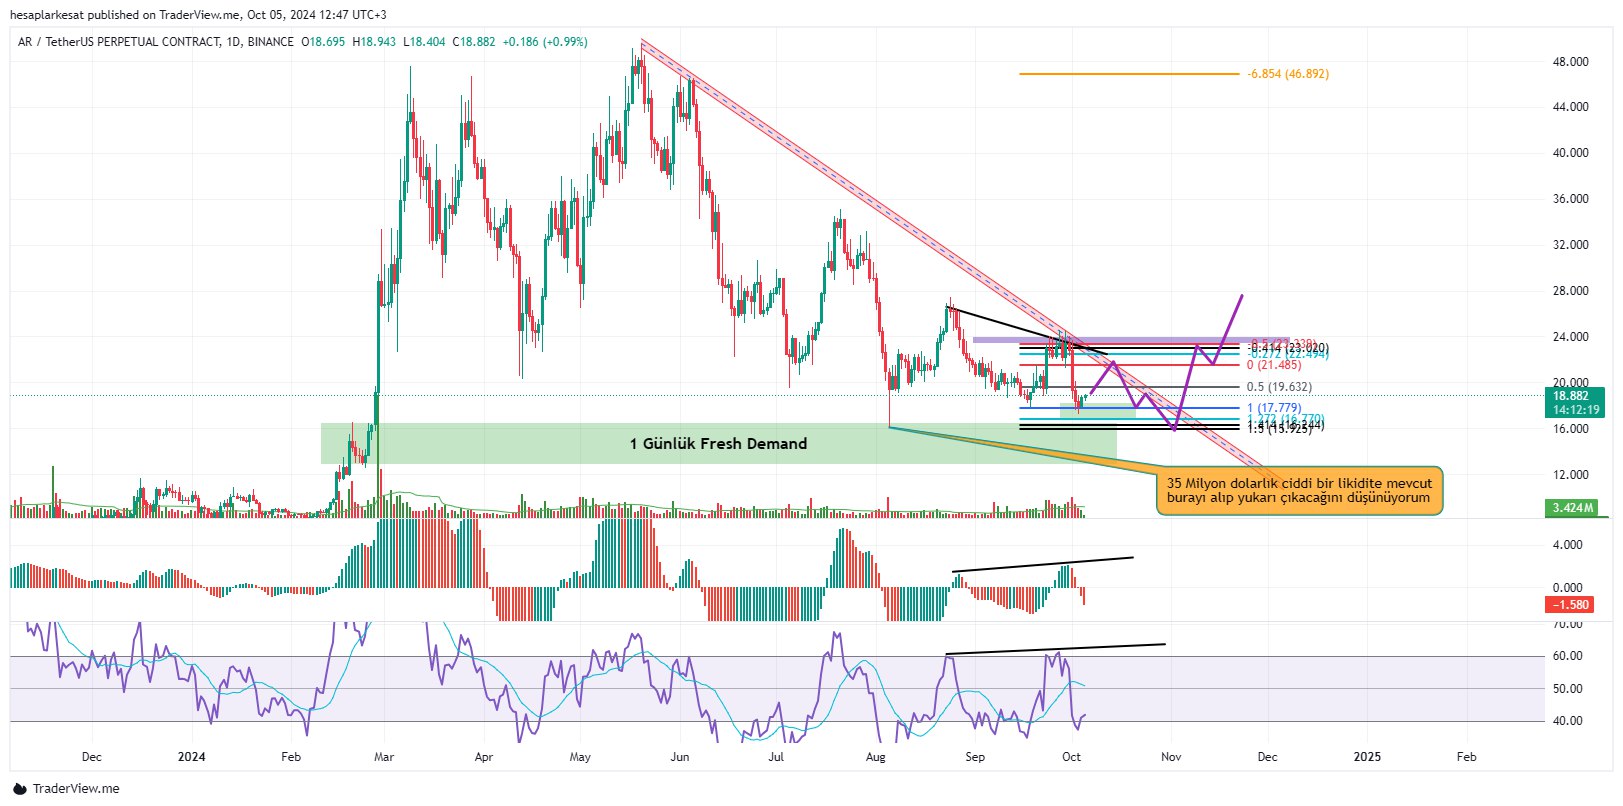
ARUSDTP
ARUSDTP. Binance__On a daily basis, there was a good reaction from the fresh demand zone, but there is a high amount of liquidity in the needle. For the first step of the uptrend on the…
-

05.10.2024 CRYTPO AND FOREX DEVELOPMENTS
💫Bitcoin is trading at $62,111, up 1.2% at the time of writing, and at 2,193,470 TL against the Turkish lira.Ethereum (ETH) up 2% 💫The dollar index (DXY) is hovering at 101.91.Bitcoin’s market capitalization is around…
-
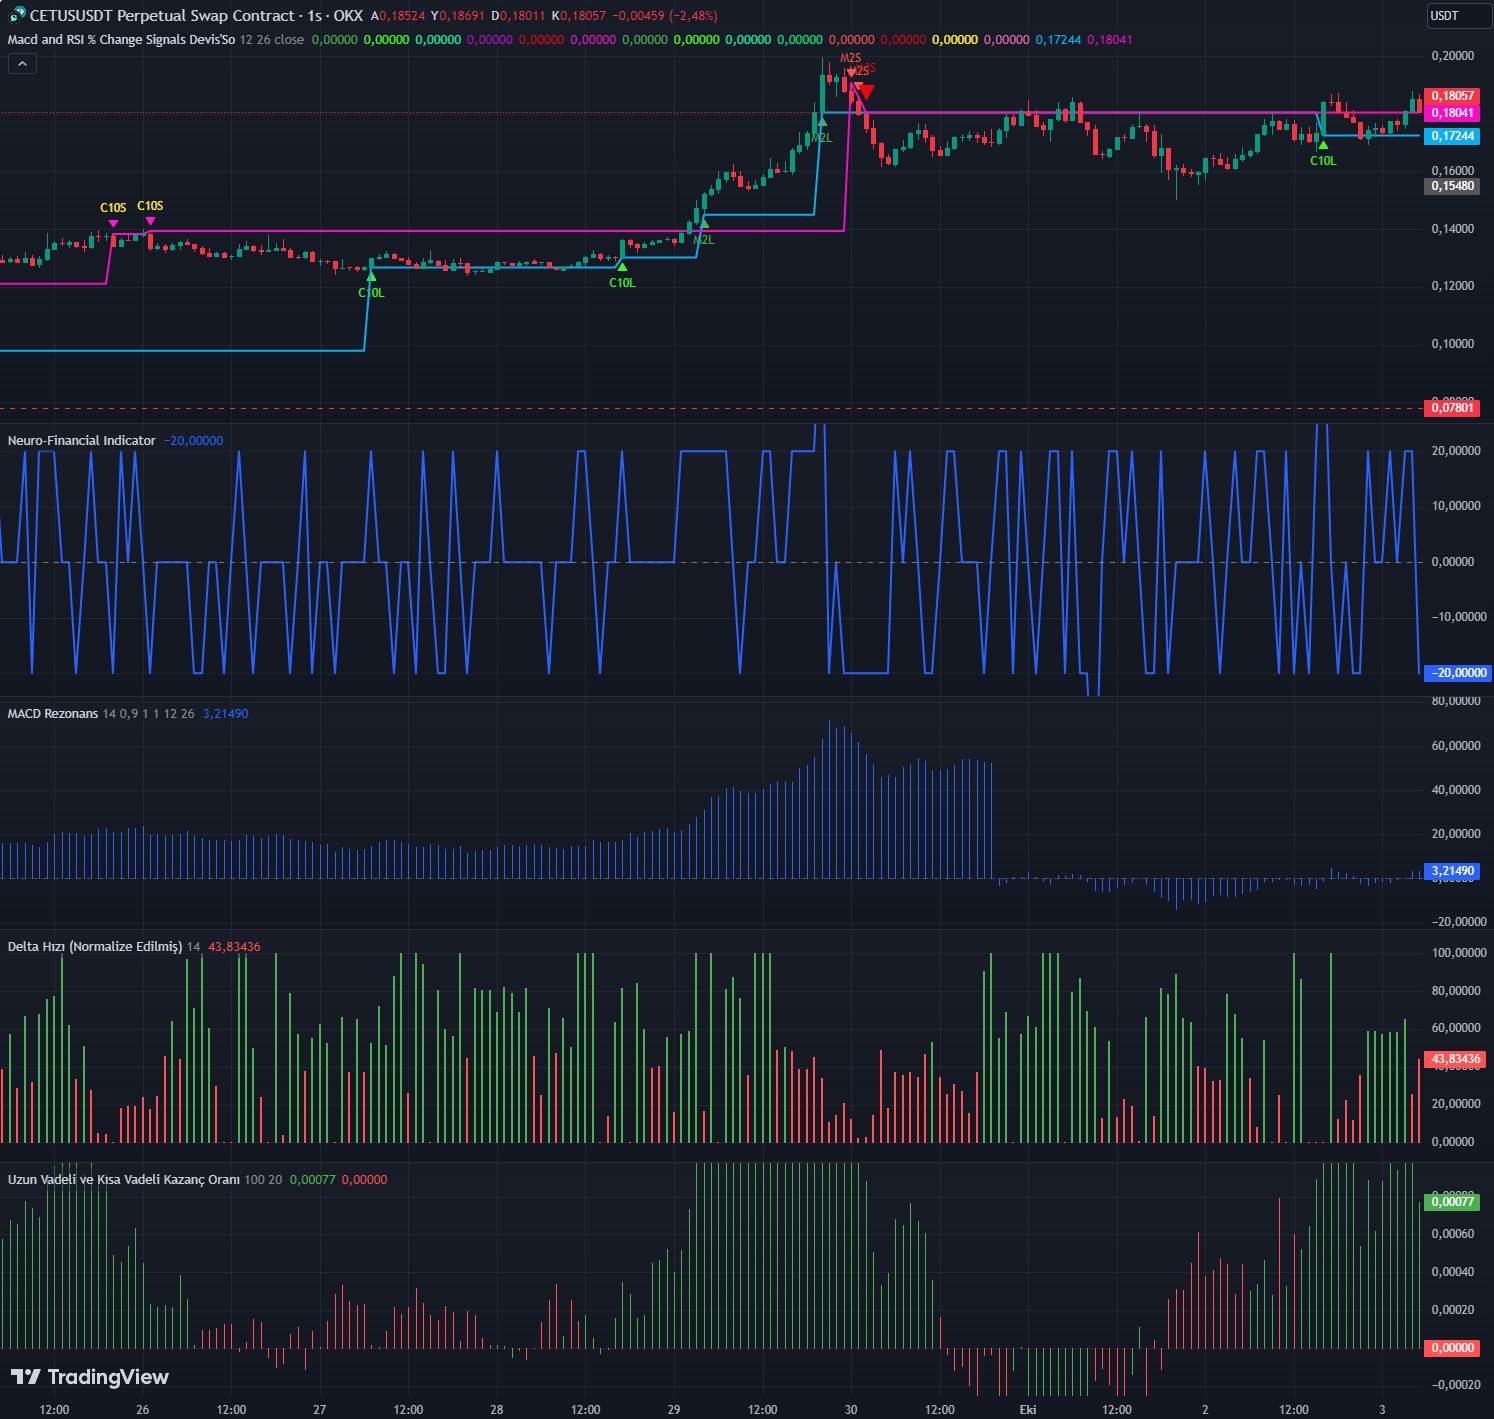
Macd and RSI % Change Signals
engineerofmoney tarafından 20% change creates very strong candles and leads to trend reversals. When 10% candles form, you can trade in a way that liquidates these candles. Similarly, for MACD, there are strengths of 2%,…


